Container Insights is a part of Amazon CloudWatch, which is AWS’s monitoring and observability service. It provides a unified view of containerized applications, helping you gain insights into the health, performance, and utilization of your containers.
Container Insights is available for Amazon Elastic Container Service (Amazon ECS), Amazon Elastic Kubernetes Service (Amazon EKS), and Kubernetes platforms on Amazon EC2.
This article will focus on configuring CloudWatch Container Insights on Amazon EKS (Elastic Kubernetes Service).
What are Amazon CloudWatch – Container Insights?
Container Insights is a feature that allows you to collect, aggregate, and monitor metrics, logs, and traces from your Kubernetes applications running on Amazon EKS. It provides observability into your containerized applications, helping you understand their performance and troubleshoot issues effectively.
Key Features of Container Insights
Here are the key components and features of EKS Container Insights, especially focusing on CloudWatch Container Insights:
Metrics:
EKS Container Insights collects a set of metrics from your EKS clusters, nodes, containers, and services. These metrics cover resource utilization, performance, and other key aspects of your containerized applications. Examples of metrics include CPU utilization, memory usage, disk I/O, and network activity.
Logs:
Container Insights aggregates logs generated by your containers and applications running on EKS. These logs can include application logs, container logs, and system logs. Centralized log collection and analysis facilitate debugging and troubleshooting.
Tracing:
EKS Container Insights supports the collection of traces, allowing you to monitor the end-to-end flow of requests across micro services in your Kubernetes applications. Tracing helps identify performance bottlenecks and understand the interactions between different components.
Integration with AWS X-Ray:
EKS Container Insights seamlessly integrates with AWS X-Ray, which is a distributed tracing service. This integration allows you to visualize and analyze traces across your containerized applications, providing insights into application performance and dependencies.
Automatic Discovery and Dashboards:
EKS Container Insights provides automatic discovery of your Kubernetes resources and creates pre-configured dashboards in CloudWatch. These dashboards offer a consolidated and visual representation of the health and performance of your containerized applications.
Resource Utilization and Efficiency:
With the metrics and insights provided by Container Insights, you can optimize resource utilization and improve the efficiency of your EKS clusters. This includes identifying underutilized or over utilized resources and making informed decisions on scaling.
Alarming and Notifications:
You can set up alarms in CloudWatch based on the collected metrics to receive notifications when certain thresholds are breached. This proactive monitoring helps in identifying and addressing issues before they impact application performance.
Step-by-Step Instructions for Setting up Container Insights on Amazon EKS
1. Let’s first quickly setup EKS cluster using eksctl. Download eksctl and move to /usr/local/bin
[root@centos9 temp]# curl –silent –location “https://github.com/weaveworks/eksctl/releases/latest/download/eksctl_$(uname -s)_amd64.tar.gz” | tar xz -C /tmp
[root@centos9 temp]# cd /tmp
[root@centos9 tmp]# mv eksctl /usr/local/bin/[root@centos9 tmp]# eksctl version
0.167.0
[root@centos9 tmp]#
2. Download kubectl and move to /usr/local/bin
[root@centos9 tmp]# curl -LO “https://dl.k8s.io/release/$(curl -L -s https://dl.k8s.io/release/stable.txt)/bin/linux/amd64/kubectl”
% Total % Received % Xferd Average Speed Time Time Time Current
Dload Upload Total Spent Left Speed
100 138 100 138 0 0 392 0 –:–:– –:–:– –:–:– 390
100 47.4M 100 47.4M 0 0 683k 0 0:01:11 0:01:11 –:–:– 909k
[root@centos9 tmp]#
[root@centos9 tmp]# mv kubectl /usr/local/bin/
[root@centos9 tmp]# chmod +x /usr/local/bin/kubectl
3. Create a new EKS cluster using eksctl command. You will see logs indicating the status of the cluster creation. Wait until the cluster is ready:
[root@centos9 tmp]# eksctl create cluster –name bdrcls –version 1.25 –region us-east-1 –nodegroup-name std-workers –node-type t3.micro –nodes 2 –nodes-min 1 –nodes-max 2 –managed
2023-12-23 17:16:28 [ℹ] eksctl version 0.167.0
2023-12-23 17:16:28 [ℹ] using region us-east-1
2023-12-23 17:16:30 [ℹ] skipping us-east-1e from selection because it doesn’t support the following instance type(s): t3.micro
2023-12-23 17:16:30 [ℹ] setting availability zones to [us-east-1f us-east-1b]
2023-12-23 17:16:30 [ℹ] subnets for us-east-1f – public:192.168.0.0/19 private:192.168.64.0/19
2023-12-23 17:16:30 [ℹ] subnets for us-east-1b – public:192.168.32.0/19 private:192.168.96.0/19
2023-12-23 17:16:30 [ℹ] nodegroup “std-workers” will use “” [AmazonLinux2/1.25]
2023-12-23 17:16:30 [ℹ] using Kubernetes version 1.25
2023-12-23 17:16:30 [ℹ] creating EKS cluster “bdrcls” in “us-east-1” region with managed nodes
2023-12-23 17:16:30 [ℹ] will create 2 separate CloudFormation stacks for cluster itself and the initial managed nodegroup
2023-12-23 17:16:30 [ℹ] if you encounter any issues, check CloudFormation console or try ‘eksctl utils describe-stacks –region=us-east-1 –cluster=bdrcls’
2023-12-23 17:16:30 [ℹ] Kubernetes API endpoint access will use default of {publicAccess=true, privateAccess=false} for cluster “bdrcls” in “us-east-1”
2023-12-23 17:16:30 [ℹ] CloudWatch logging will not be enabled for cluster “bdrcls” in “us-east-1”2023-12-23 17:16:30 [ℹ] you can enable it with ‘eksctl utils update-cluster-logging –enable-types={SPECIFY-YOUR-LOG-TYPES-HERE (e.g. all)} –region=us-east-1 – -cluster=bdrcls’
2023-12-23 17:16:30 [ℹ]
2 sequential tasks: { create cluster control plane “bdrcls”,
2 sequential sub-tasks: {
wait for control plane to become ready,
create managed nodegroup “std-workers”,
}
}
2023-12-23 17:16:30 [ℹ] building cluster stack “eksctl-bdrcls-cluster”
2023-12-23 17:16:32 [ℹ] deploying stack “eksctl-bdrcls-cluster”
2023-12-23 17:17:02 [ℹ] waiting for CloudFormation stack “eksctl-bdrcls-cluster”
2023-12-23 17:17:33 [ℹ] waiting for CloudFormation stack “eksctl-bdrcls-cluster”
2023-12-23 17:18:34 [ℹ] waiting for CloudFormation stack “eksctl-bdrcls-cluster”
2023-12-23 17:19:35 [ℹ] waiting for CloudFormation stack “eksctl-bdrcls-cluster”
2023-12-23 17:20:36 [ℹ] waiting for CloudFormation stack “eksctl-bdrcls-cluster”
2023-12-23 17:21:37 [ℹ] waiting for CloudFormation stack “eksctl-bdrcls-cluster”
2023-12-23 17:22:38 [ℹ] waiting for CloudFormation stack “eksctl-bdrcls-cluster”
2023-12-23 17:23:39 [ℹ] waiting for CloudFormation stack “eksctl-bdrcls-cluster”
2023-12-23 17:24:40 [ℹ] waiting for CloudFormation stack “eksctl-bdrcls-cluster”
2023-12-23 17:25:41 [ℹ] waiting for CloudFormation stack “eksctl-bdrcls-cluster”
2023-12-23 17:28:37 [ℹ] building managed nodegroup stack “eksctl-bdrcls-nodegroup-std-workers”
2023-12-23 17:28:39 [ℹ] deploying stack “eksctl-bdrcls-nodegroup-std-workers”
2023-12-23 17:28:39 [ℹ] waiting for CloudFormation stack “eksctl-bdrcls-nodegroup-std-workers”
2023-12-23 17:29:10 [ℹ] waiting for CloudFormation stack “eksctl-bdrcls-nodegroup-std-workers”
2023-12-23 17:29:42 [ℹ] waiting for CloudFormation stack “eksctl-bdrcls-nodegroup-std-workers”
2023-12-23 17:31:13 [ℹ] waiting for CloudFormation stack “eksctl-bdrcls-nodegroup-std-workers”
2023-12-23 17:31:13 [ℹ] waiting for the control plane to become ready
2023-12-23 17:31:14 [✔] saved kubeconfig as “/root/.kube/config”
2023-12-23 17:31:14 [ℹ] no tasks
2023-12-23 17:31:14 [✔] all EKS cluster resources for “bdrcls” have been created
2023-12-23 17:31:15 [ℹ] nodegroup “std-workers” has 2 node(s)
2023-12-23 17:31:15 [ℹ] node “ip-192-168-26-133.ec2.internal” is ready
2023-12-23 17:31:15 [ℹ] node “ip-192-168-36-125.ec2.internal” is ready
2023-12-23 17:31:15 [ℹ] waiting for at least 1 node(s) to become ready in “std-workers”
2023-12-23 17:31:15 [ℹ] nodegroup “std-workers” has 2 node(s)
2023-12-23 17:31:15 [ℹ] node “ip-192-168-26-133.ec2.internal” is ready
2023-12-23 17:31:15 [ℹ] node “ip-192-168-36-125.ec2.internal” is ready
2023-12-23 17:31:15 [✖] kubectl not found, v1.10.0 or newer is required
2023-12-23 17:31:15 [ℹ] cluster should be functional despite missing (or misconfigured) client binaries
2023-12-23 17:31:15 [✔] EKS cluster “bdrcls” in “us-east-1” region is ready
[root@centos9 tmp]#
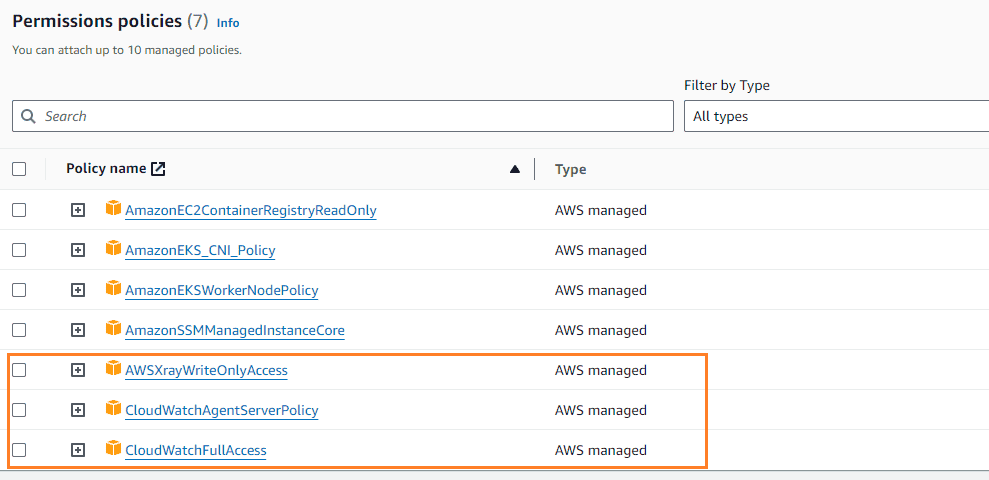
4. Ensure that the node IAM role has the following policies attached.

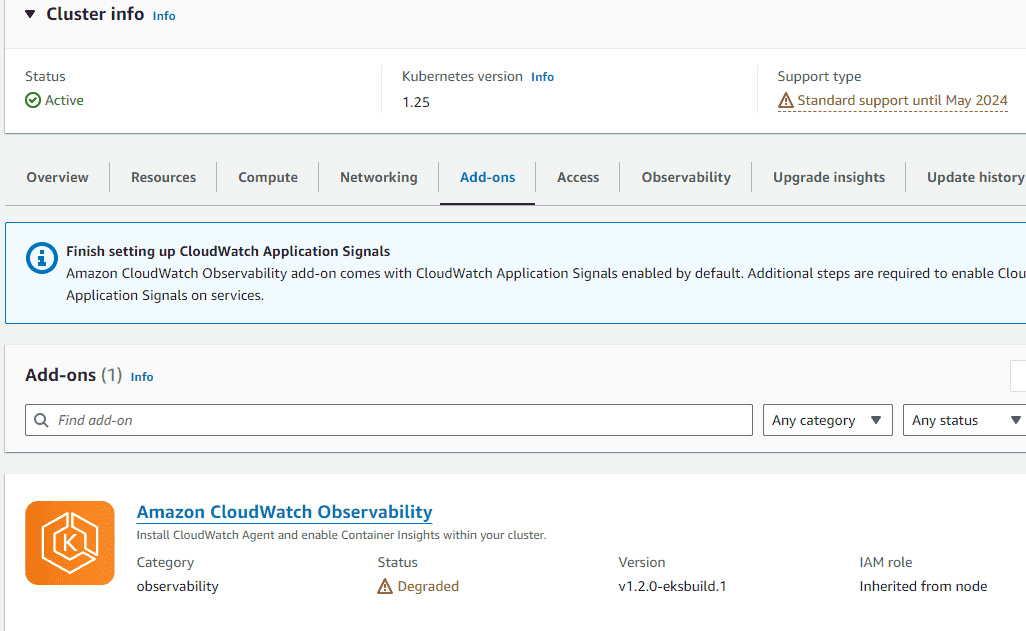
5. Add the CloudWatch add-on in EKS – “Amazon CloudWatch Observability”
6. Run the following command to enable fluentd for collecting logs.
$ curl https://raw.githubusercontent.com/aws-samples/amazon-cloudwatch-container-insights/latest/k8s-deployment-manifest-templates/deployment-mode/daemonset/container-insights-monitoring/quickstart/cwagent-fluentd-quickstart-enhanced.yaml | sed “s/{{cluster_name}}/bdrcls/;s/{{region_name}}/us-east-1/” | kubectl apply -f –
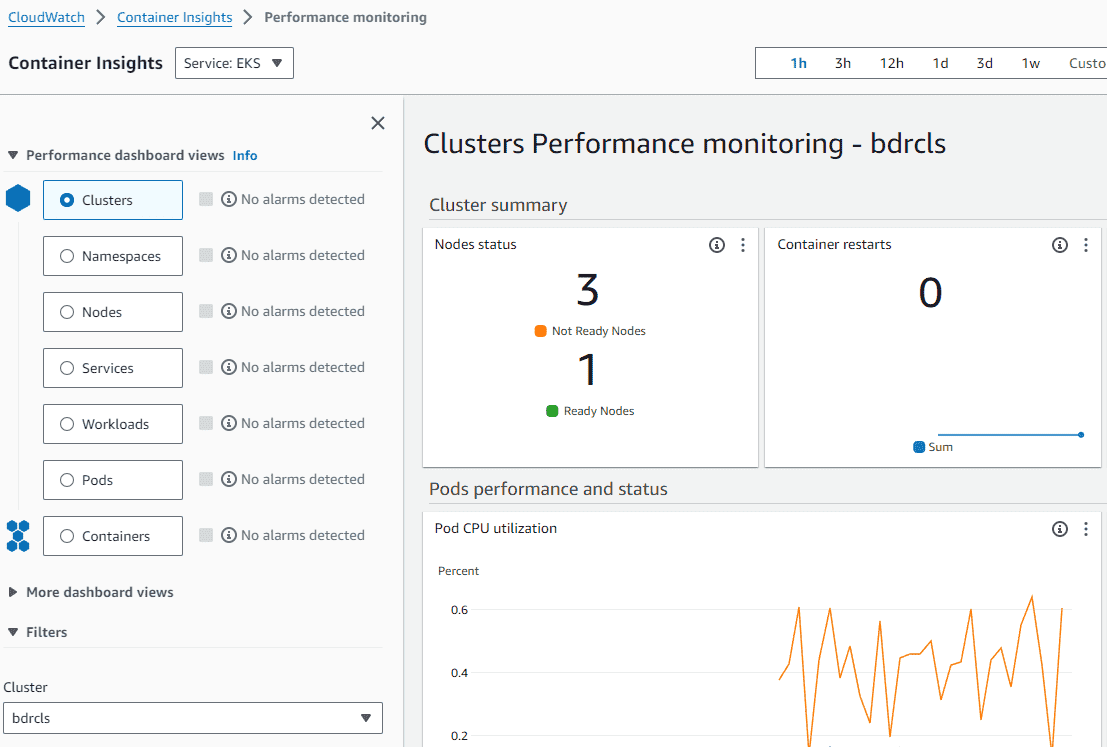
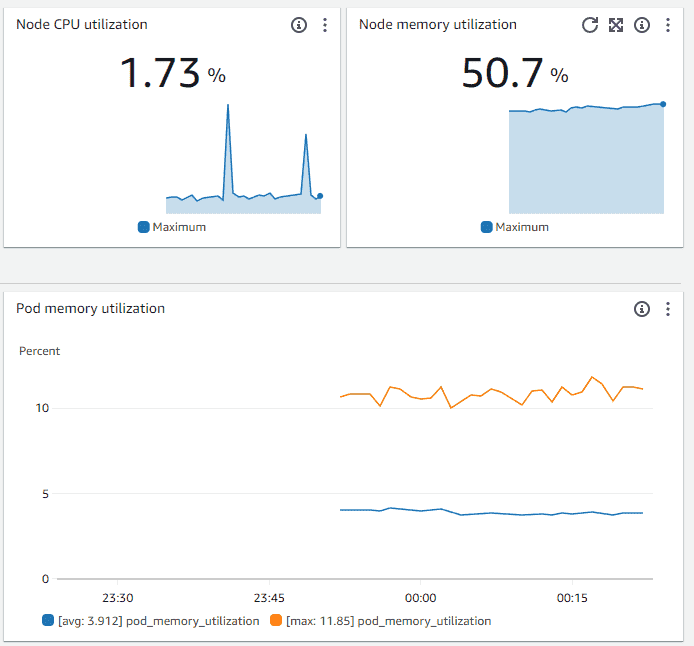
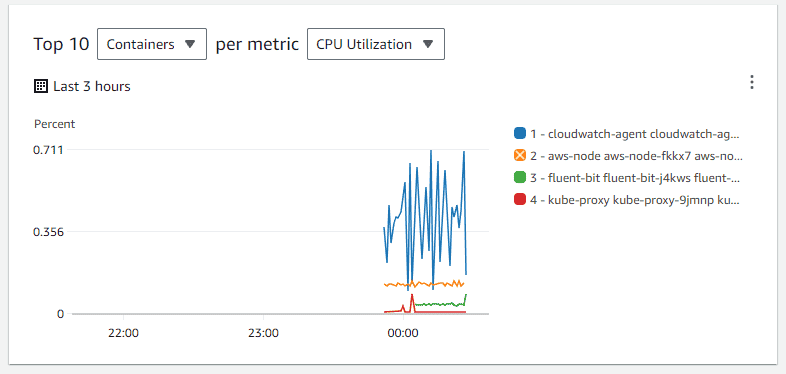
7. On the CloudWatch console, Navigate to ‘Container Insights‘, choose the service as ‘EKS‘ and view the EKS cluster performance statistics
Conclusion
By leveraging EKS Container Insights, AWS customers can enhance the observability of their containerized applications, leading to better operational efficiency, faster issue resolution, and improved overall performance.
Read more:
AWS for Beginners: How to Create Amazon EKS cluster using CLI? – Part 45
AWS for Beginners: What is Amazon Lightsail and How to Create a Lightsail Instance – Part 62
AWS for Beginners: What is AWS WorkSpaces and How it Works? – Part 61
AWS for Beginners: What is Amazon Data Lifecycle Manager and How to Create Policies for Automating EBS Snapshot Lifecycle Management – Part 60
AWS for Beginners: How to Build a Linear Regression Model with AWS SageMaker – Part 59
Follow our Twitter and Facebook feeds for new releases, updates, insightful posts and more.


Leave A Comment